On 29 September, ISAPS released its 2025 Global Survey. The ASPS report we discussed earlier mainly covers plastic surgeons in the United States, while ISAPS estimates the volume of procedures performed by plastic surgeons worldwide. The two sets of figures cannot be directly combined or compared.
The headline figure in the new report is 35.204 million procedures. ISAPS reports an 8.7% in the comparable total from the previous year. Yet surgery, non-surgical treatments and individual procedures do not all follow the same trend.
01|The 2025 total and its components
| Category | 2025 estimate / comparable year-on-year change |
|---|---|
| All procedures | 35.204 million / -8.7% |
| Aesthetic surgery | 17.884 million / -0.4% |
| Non-surgical procedures | 17.320 million / -15.7% |
| Differences within surgery | Face and head +3.2%; breast +5.7%; body and extremities -8.9% |
| Differences within non-surgical care | Injectables -16.2%; facial rejuvenation -0.8%; other -29.3% |
The overall decline was driven mainly by non-surgical procedures. Among the three surgical categories, breast and face/head procedures rose while body and extremity procedures fell. All three non-surgical categories declined. [1, pp. 11–13]
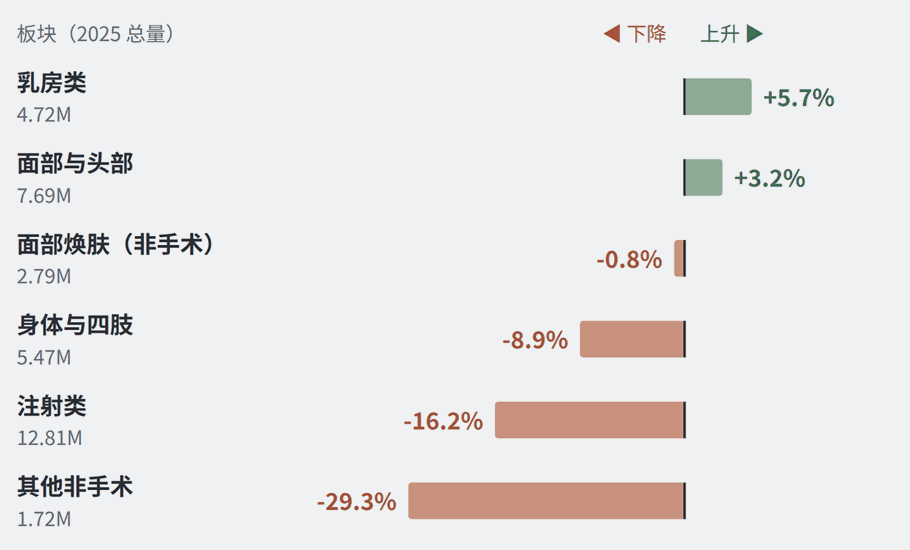
The report added some procedures, and the number of countries or regions reported separately rose from 32 to 51. The “2025 estimated total” and the “year-on-year change in comparable procedures” therefore answer different questions. In particular, the published surgical total is higher than in 2024, but the official comparable year-on-year figure is still -0.4%. The former cannot simply be described as growth in the surgery market. [1, p. 4, pp. 9–13]
02|What is growing in surgery, and what is declining in non-surgical care?
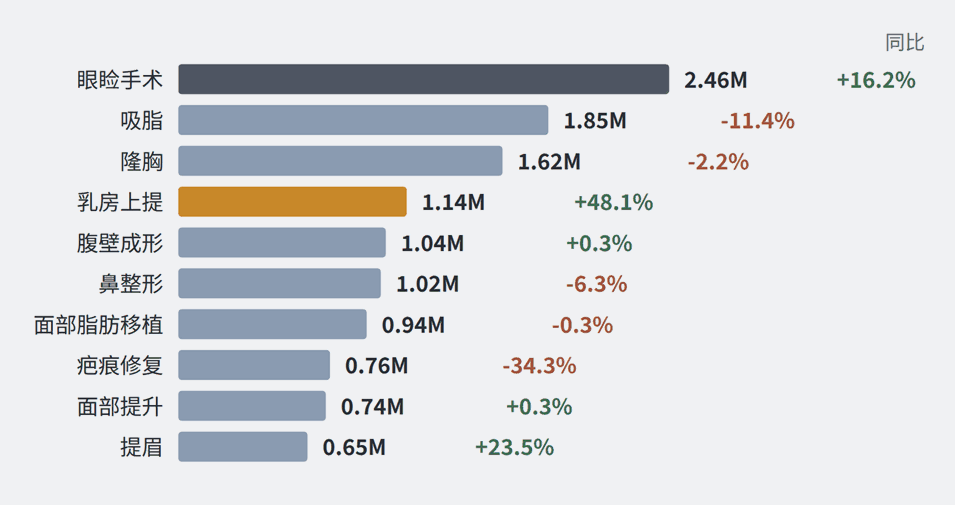
Eyelid surgery remained the most common operation at 2.458 million procedures, up 16.2% from the previous year. Breast lifts rose 48.1% and entered the surgical top five. Liposuction remained second, but fell 11.4% year on year. The stability of the ranking conceals differences in the direction of individual procedures. [1, p. 9]
The split is even clearer in non-surgical care. Among the top ten procedures, only non-surgical skin tightening grew: it reached 1.529 million procedures, up 23.3%. Botulinum toxin remained the largest category but fell 7.0%; hyaluronic acid treatments fell 25.2%, or about 1.6 million procedures from the year before. [1, p. 10]
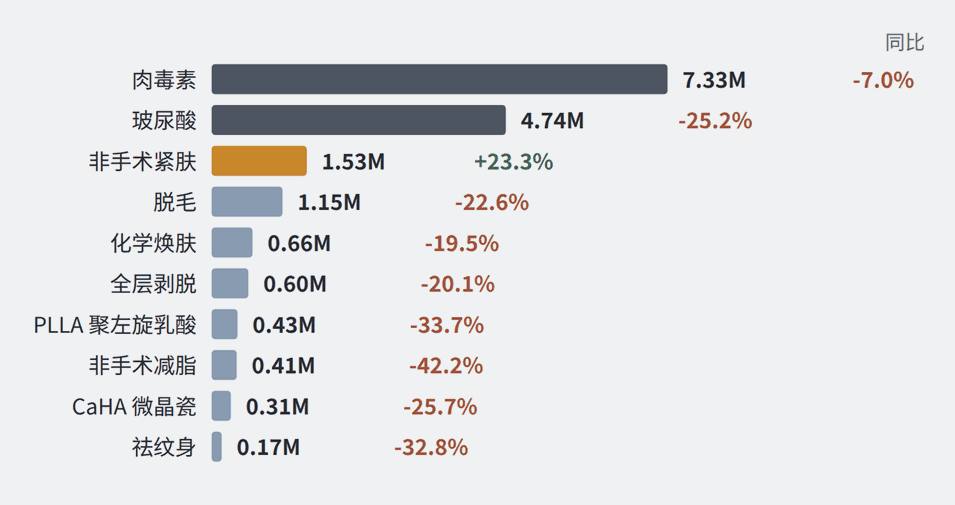
This supports a clear assessment of the year: not every aesthetic procedure cooled in 2025; the pressure was concentrated in frequent non-surgical treatments, especially injectables. The report does not establish whether this came from end-user demand, the mix of providers, regional composition, or several factors together.
03|A six-year view: a higher total and a reversal between surgical and non-surgical procedures
Looking at each year’s published estimates, global procedure volume rose from about 24.53 million in 2020 to about 35.20 million in 2025, an increase of roughly 44%. It reached about 37.95 million in 2024 before declining for the first time. This series shows the history of reported estimates; it is not a strictly like-for-like market growth curve. Procedure definitions and sample coverage changed in 2025. [1, p. 4; 3]
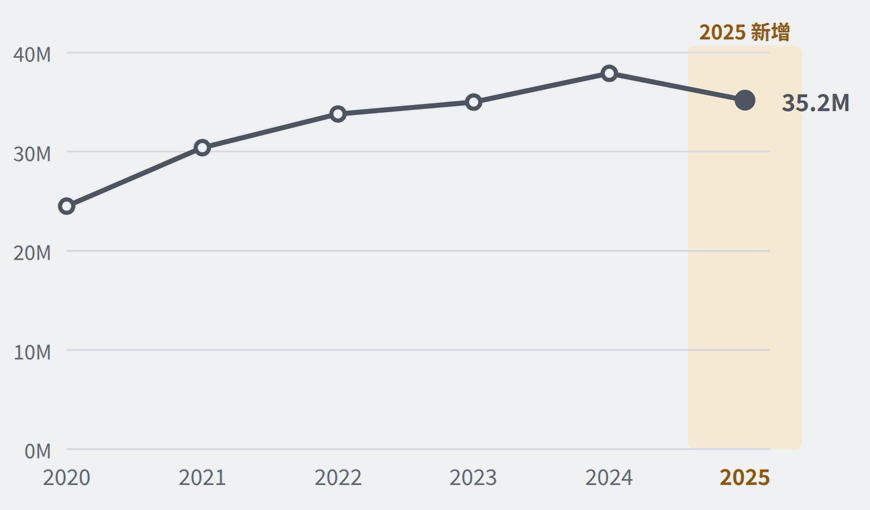
The changing mix is more revealing. Across the published estimates for 2020–2025, surgical volume rose about 77% and non-surgical volume about 20%. In 2025, the published surgical volume exceeded the non-surgical volume for the first time. These cross-year changes describe published estimates and should not be treated as fully comparable growth rates. [1, pp. 9–13; 3]
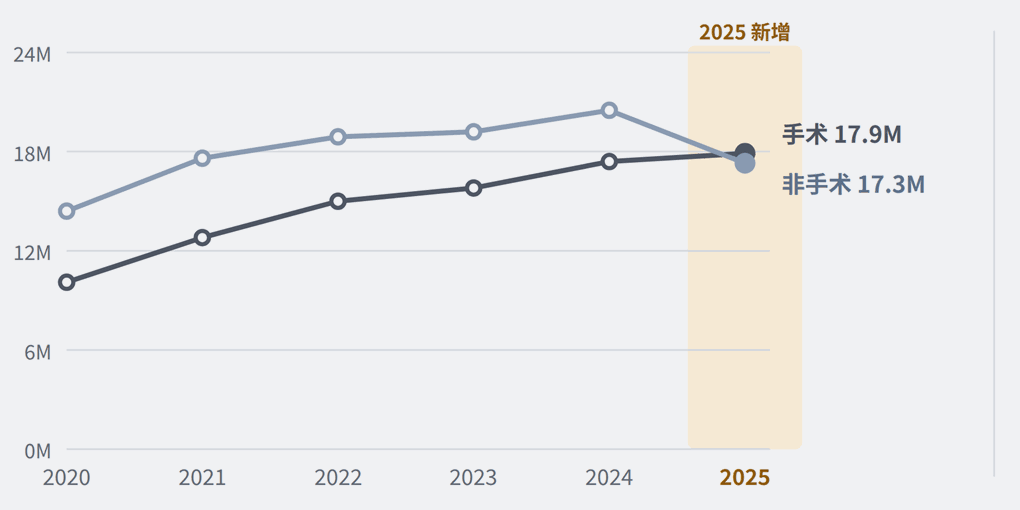
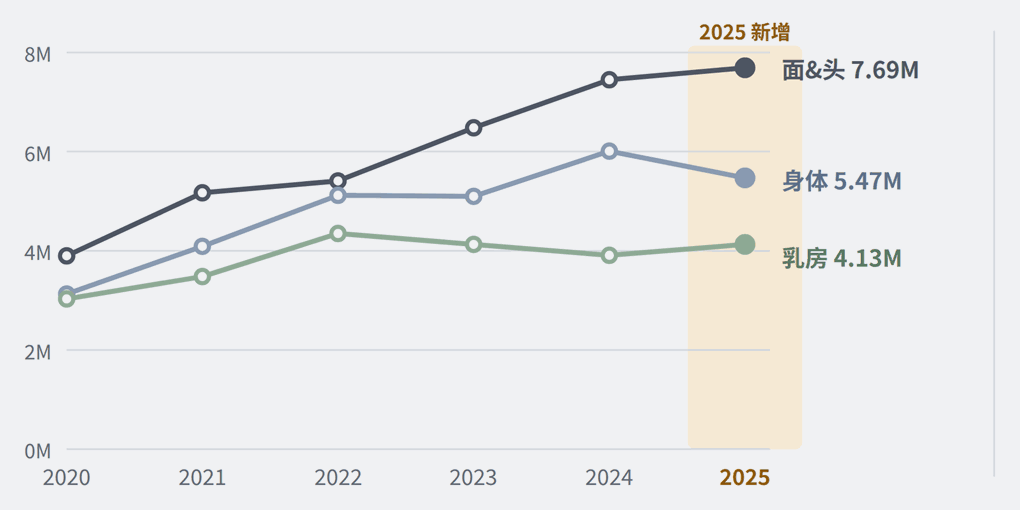
The changes within surgery show more continuity. Face and head procedures expanded throughout the six years, reaching 7.686 million in 2025; body and extremity procedures fell 8.9% in 2025. The published 2025 breast total includes the newly added “secondary breast surgery” category, so its difference from the previous year cannot all be treated as organic growth. [1, p. 11]
04|Injectables: procedure volume and surgeon participation diverge
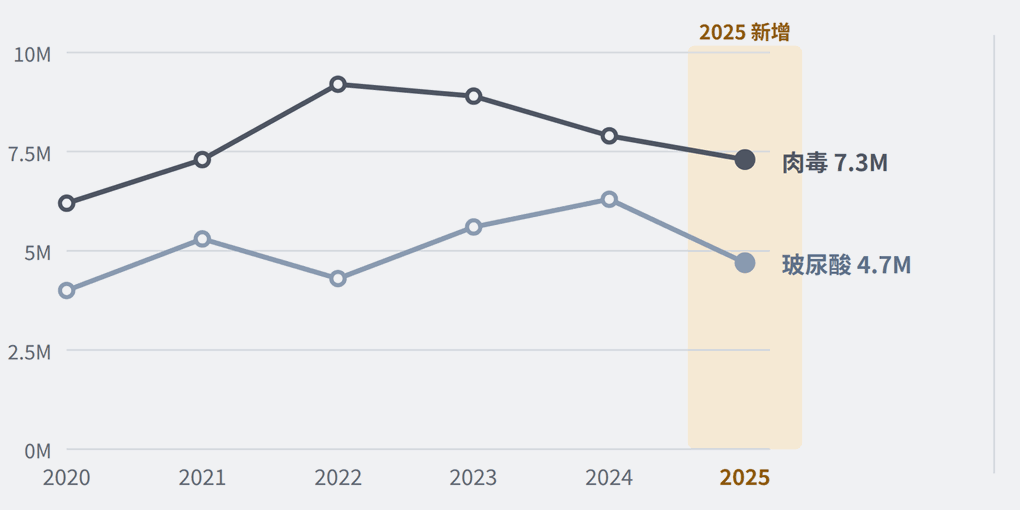
Botulinum toxin volume has declined continuously since its 2022 peak. The 2025 estimate for hyaluronic acid treatments was 4.738 million procedures, below the 2021 level shown in the report. Together, these still account for nearly 70% of non-surgical procedures, but being a large category does not mean it is still growing. [1, p. 10]
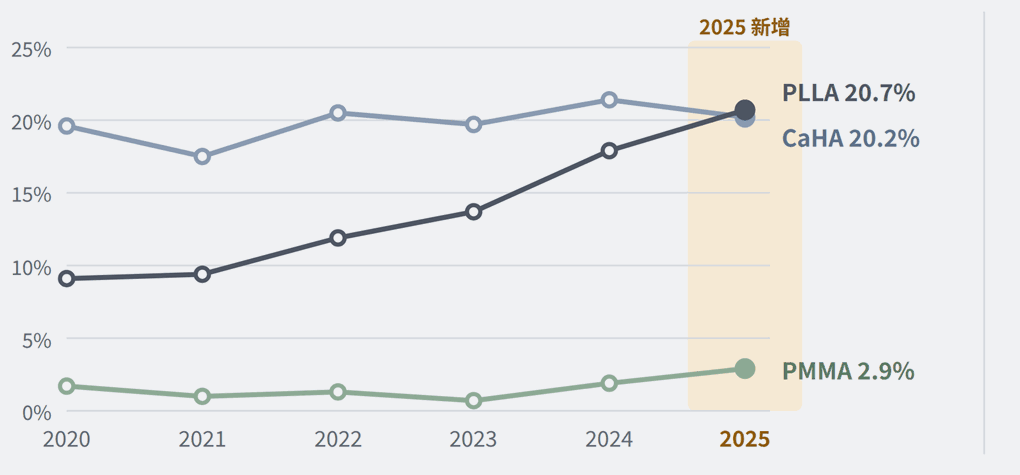
Surgeon participation tells another story. The share of surveyed plastic surgeons who performed PLLA procedures rose from about 9.1% in 2020 to 20.7% in 2025, slightly above CaHA’s 20.2%. Yet estimated PLLA procedure volume still fell 33.7% in 2025. More surgeons offering a procedure and more procedures being performed in a given year are different things. There is also currently no evidence that PLLA or other regenerative materials have absorbed the treatment volume lost by hyaluronic acid. [1, pp. 10, 97; 3]
05|Beyond country rankings: examine the surgical and non-surgical mix
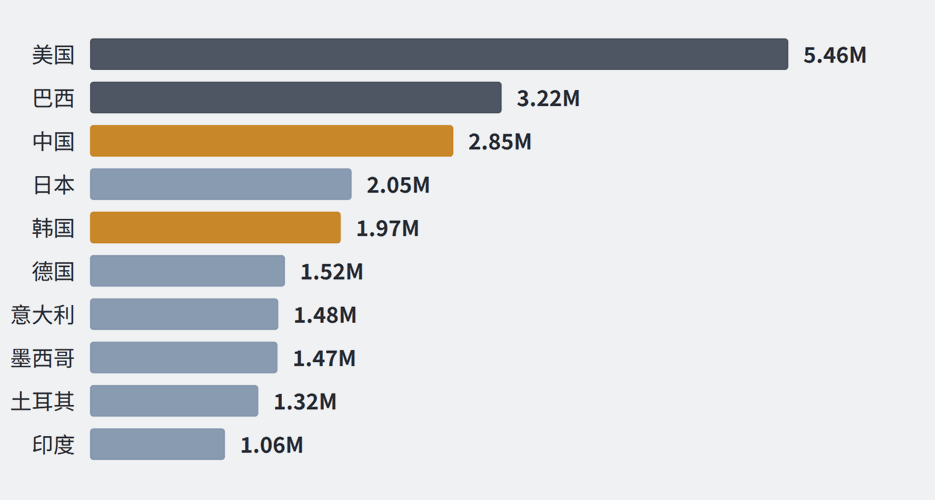
Among countries or regions reported separately in 2025, the United States ranked first with 5.461 million procedures, Brazil second with 3.217 million, China third with 2.845 million, and South Korea fifth with 1.966 million. Compared with 2024, China and South Korea entered the separately reported 2025 ranking, offering a clearer picture of the procedure mix among plastic surgeons in East Asia. [1, pp. 18–19, 83]
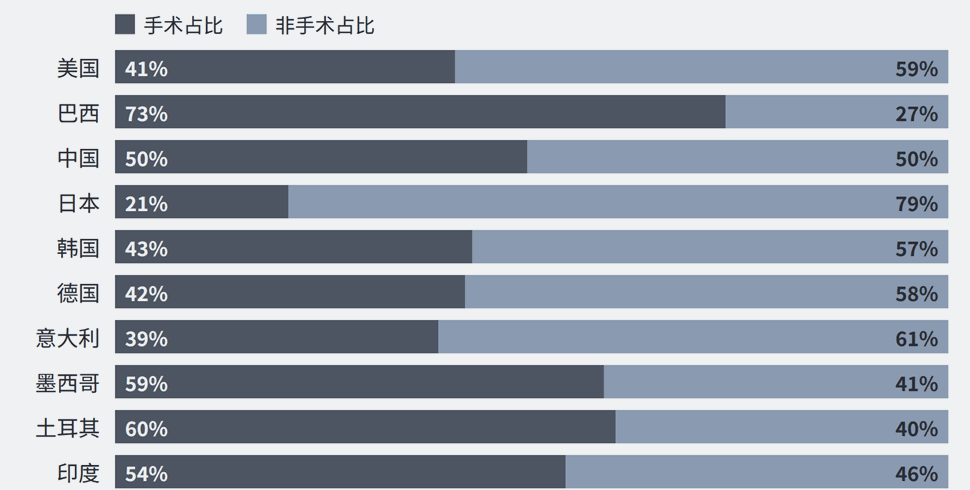
Even among the top ten, the mix varies widely. Surgery accounted for about 73% of procedures in Brazil; non-surgical treatments accounted for about 79% in Japan. In the United States, non-surgical care made up about 59%; in China, surgical and non-surgical procedures were almost evenly split. Similar national totals do not imply a similar mix of procedure demand or provider capability. [1, p. 83]
Conclusion|Four questions to test next
The clearest signals in 2025 were a decline in non-surgical procedures, broadly flat surgical volume, and relative resilience in facial and lifting procedures. The six-year charts also show that the published total remains well above 2020, but turned in 2025, while the relative positions of surgical and non-surgical procedures reversed.
Four issues warrant continued checking: whether the fall in hyaluronic acid treatments occurred across regions and specialties; whether growth in skin tightening and lifting can last; when rising surgeon participation in regenerative materials might translate into procedure volume; and whether changes in East Asia’s mix can be confirmed next year now that China and South Korea are included in the fuller statistics. These are questions for future observation, not causal answers already provided by the 2025 report.
Sources
[1] International Society of Aesthetic Plastic Surgery, ISAPS International Survey on Aesthetic/Cosmetic Procedures Performed in 2025, released 29 September 2026, pp. 4, 9—13, 18—19, 83, 97. https://www.isaps.org/media/ua4leneo/isaps-global-survey_2025.pdf
[2] American Society of Plastic Surgeons, 2025 Plastic Surgery Statistics Report. https://www.plasticsurgery.org/documents/news/statistics/2025/plastic-surgery-statistics-report-2025.pdf
[3] ISAPS, Global Survey 2020–2024; the historical charts were compiled by Aesthetic Reflections from the annual reports. https://www.isaps.org/discover/about-isaps/global-statistics/
Data note: “Procedures” refers to the estimated number of procedures performed, not the number of unique patients. The 2020–2025 curves use the figures published in the respective annual reports; 2025 year-on-year comparisons use the changes for comparable procedures published by ISAPS.